Note
Go to the end to download the full example code.
EDFS Spectrum (#1)
This example demonstrates how to load and plot an Echo-Detected Field-Sweep (EDFS) spectrum.
import spinlab as sl
import numpy as np
Once the Python environment is properly set up the data files can be loaded.
data_CQ = sl.load("../data/EPR/Echo-Detected Field-Sweep/17478-EDFS.exp")
data_E580 = sl.load("../data/EPR/Echo-Detected Field-Sweep/33725-EDFS.DTA")
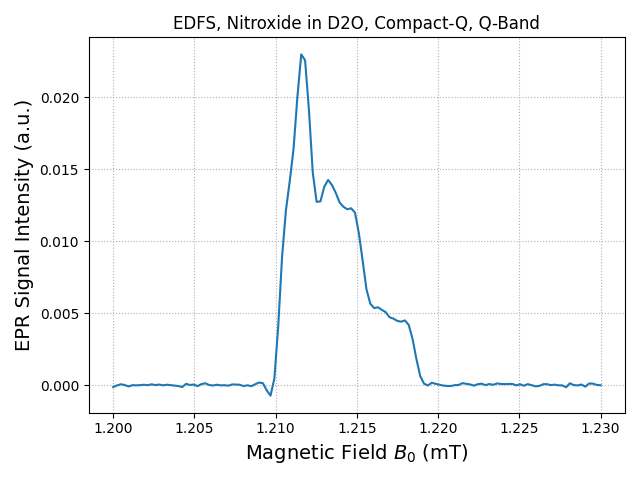
Compact-Q: Nitroxide in D2O
sl.plt.figure()
sl.fancy_plot(data_CQ)
sl.plt.title("EDFS, Nitroxide in D2O, Compact-Q, Q-Band")
sl.plt.show()
The data set can be downloaded from the Sample Data page.
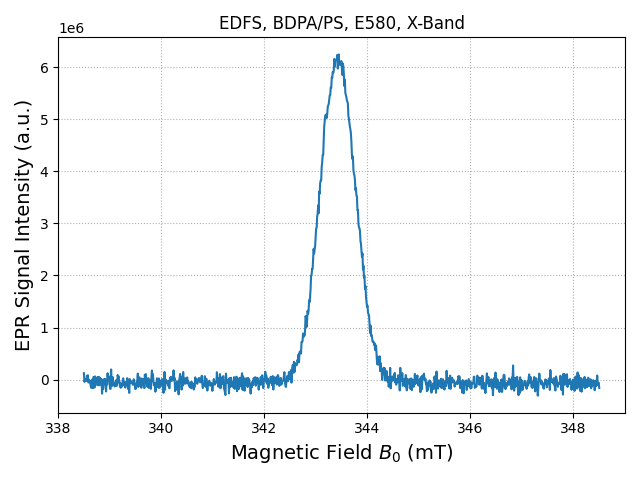
E580: BDPA/PS
sl.plt.figure()
sl.fancy_plot(data_E580)
sl.plt.title("EDFS, BDPA/PS, E580, X-Band")
sl.plt.show()
The data set can be downloaded from the Sample Data page.
Total running time of the script: (0 minutes 0.265 seconds)