Note
Go to the end to download the full example code.
Three-Pulse ESEEM (#8)
This example demonstrates how to load and plot a Three-Pulse Electron Spin Echo Envelop Modulation (ESEEM) spectrum.
import spinlab as sl
import numpy as np
Once the Python environment is properly set up the data files can be loaded.
data_CQ = sl.load("../data/EPR/Three-Pulse ESEEM/17524-3PE.exp")
data_E580 = sl.load("../data/EPR/Three-Pulse ESEEM/33731-3PE.DTA")
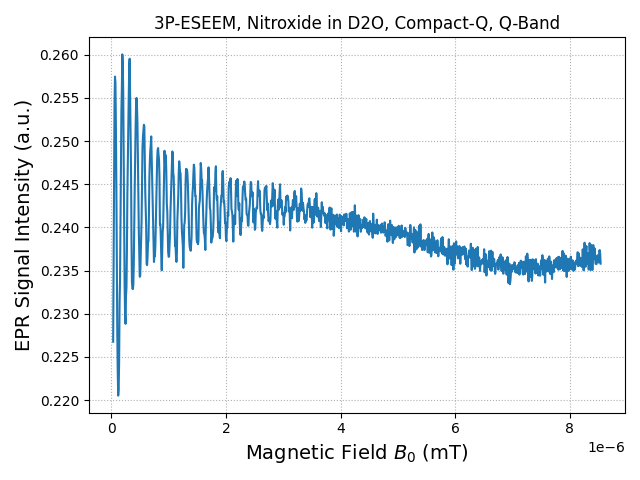
Compact-Q: Nitroxide in D2O
sl.plt.figure()
sl.fancy_plot(data_CQ)
sl.plt.title("3P-ESEEM, Nitroxide in D2O, Compact-Q, Q-Band")
sl.plt.show()
The data set can be downloaded from the Sample Data page.
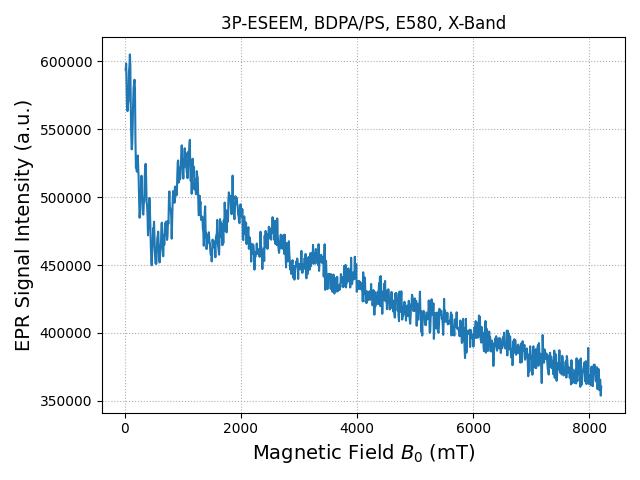
E580: BDPA/PS
sl.plt.figure()
sl.fancy_plot(data_E580)
sl.plt.title("3P-ESEEM, BDPA/PS, E580, X-Band")
sl.plt.show()
The data set can be downloaded from the Sample Data page.
Total running time of the script: (0 minutes 0.216 seconds)